
In this example we will see how to create line chart with JavaFX. We are using LineChart. In the begging we will create two NumberAxis for X and Y coordinates. We will pass them to the constructor of LineChart. Then we will create XYChart.Series object representing series of data.
We will use ObservableList and we will get it from the XYChart.Series with the method getData(). Then we will add the data to the list.After that we will set the series to the LineChart and add the chart to the StackPane.
For the last part we will add the StackPane to the Scene.
package com.example.chartdemo;
import javafx.application.Application;
import javafx.collections.ObservableList;
import javafx.scene.Scene;
import javafx.scene.chart.LineChart;
import javafx.scene.chart.NumberAxis;
import javafx.scene.chart.XYChart;
import javafx.scene.layout.StackPane;
import javafx.stage.Stage;
public class ChartExample extends Application {
@Override
public void start(Stage stage) {
// create x and y axis
final NumberAxis xAxis = new NumberAxis();
final NumberAxis yAxis = new NumberAxis();
// set labels for the axes
xAxis.setLabel("Time (s)");
yAxis.setLabel("Value");
// create line chart
final LineChart<Number, Number> lineChart = new LineChart<>(xAxis, yAxis);
// set chart title
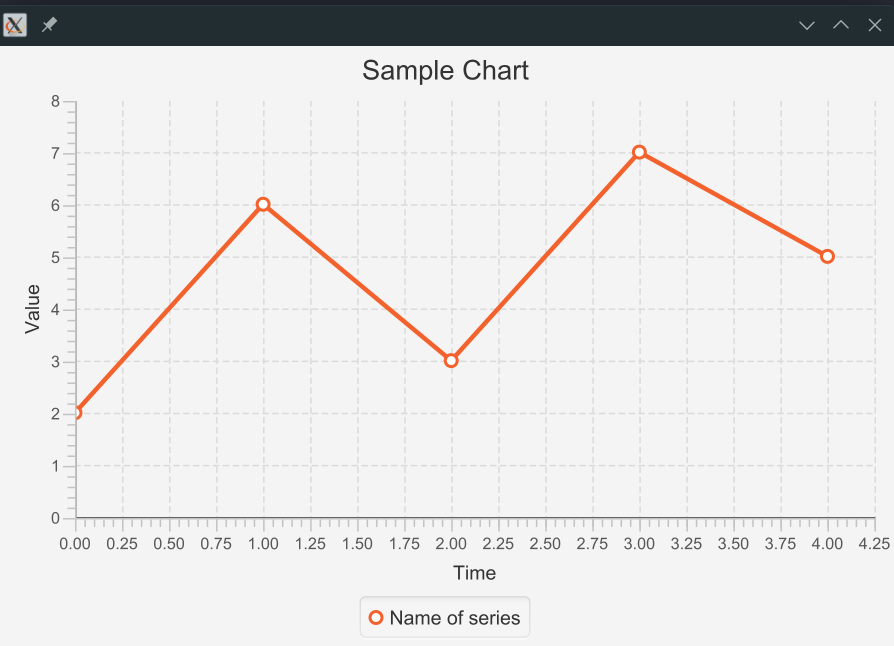
lineChart.setTitle("Sample Chart");
// create a series for the chart
XYChart.Series<Number, Number> series = new XYChart.Series<>();
// add data to the series
series.setName("Name of series");
ObservableList<XYChart.Data<Number, Number>> seriesList = series.getData();
seriesList.add(new XYChart.Data<>(0, 2));
seriesList.add(new XYChart.Data<>(1, 6));
seriesList.add(new XYChart.Data<>(2, 3));
seriesList.add(new XYChart.Data<>(3, 7));
seriesList.add(new XYChart.Data<>(4, 5));
// add the series to the chart
lineChart.getData().add(series);
// create a StackPane and add the chart to it
StackPane root = new StackPane();
root.getChildren().add(lineChart);
// create a new Scene with the StackPane as the root node
Scene scene = new Scene(root, 600, 400);
// set the scene on the stage and show it
stage.setScene(scene);
stage.show();
}
public static void main(String[] args) {
launch();
}
}
Result: